
Archived Graphs
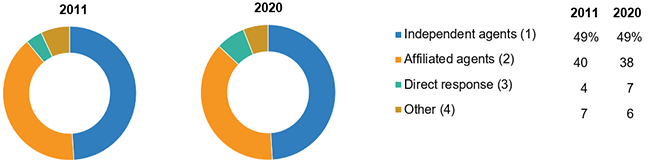
(1) Includes brokers, broker-dealers, personal producing general agents and registered investment advisers.
(2) Includes agency building, multiline exclusive and home service agents.
(3) No producers are involved. Excludes direct marketing efforts involving agents. Includes internet sales where consumers submit online applications.
(4) Includes financial institutions, worksite and other channels.
Source: U.S. Individual Life 麻豆社 Sales Trends, Industry Estimates, 1975-2020, LIMRA, 2021.
(1) Includes brokers, broker-dealers, personal producing general agents and registered investment advisers.
(2) Includes agency building, multiline exclusive and home service agents.
(3) No producers are involved. Excludes direct marketing efforts involving agents. Includes internet sales where consumers submit online applications.
(4) Includes financial institutions, worksite and other channels.
Source: U.S. Individual Life 麻豆社 Sales Trends, Industry Estimates, 1975-2020, LIMRA, 2021.
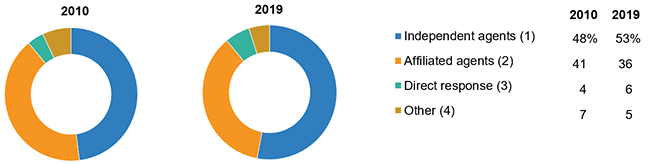
(1) Includes brokers, broker-dealers, personal producing general agents and registered investment advisers.
(2) Includes agency building, multiline exclusive and home service agents.
(3) No producers are involved. Excludes direct marketing efforts involving agents. Includes internet sales where consumers submit online applications.
(4) Includes financial institutions, worksite and other channels.
Source: U.S. Individual Life 麻豆社 Sales Trends, Industry Estimates, 1975-2019, LIMRA, 2020.
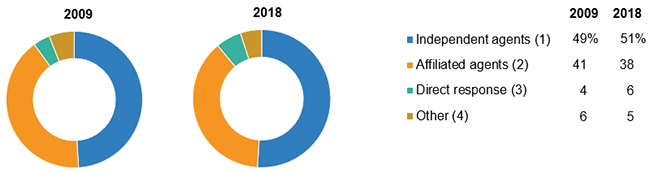
(1) Includes brokers, broker-dealers, personal producing general agents and registered investment advisers.
(2) Includes agency building, multiline exclusive and home service agents.
(3) No producers are involved. Excludes direct marketing efforts involving agents. Includes internet sales where consumers submit online applications.
(4) Includes financial institutions, worksite and other channels.
Source: U.S. Individual Life 麻豆社 Sales Trends, Industry Estimates, 1975-2018, LIMRA, 2019.
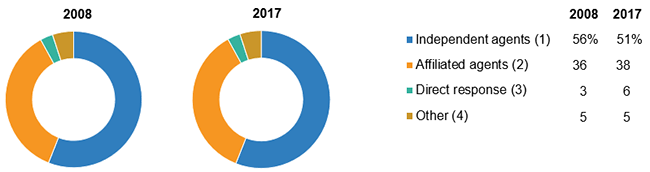
(1) Includes brokers, stockbrokers and personal producing general agents.
(2) Includes career, multiline exclusive and home service agents.
(3) No producers are involved. Excludes direct marketing efforts involving agents.
(4) Includes financial institutions, worksite and other channels.
Source: U.S. Individual Life 麻豆社 Sales Trends, 1975-2017 Estimates, LIMRA, 2018.
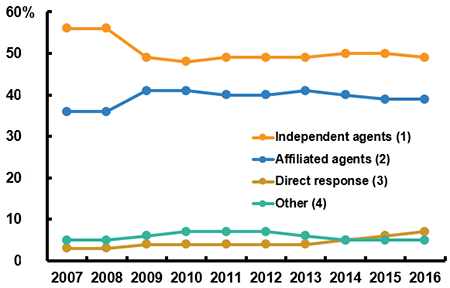
(1) Includes brokers, stockbrokers and personal producing general agents.
(2) Includes career, multiline exclusive and home service agents.
(3) No producers are involved. Excludes direct marketing efforts involving agents.
(4) Includes financial institutions, worksite and other channels.
Source: LIMRA鈥檚 U.S. Individual Life 麻豆社 Sales survey results and LIMRA estimates.
(Based on first year collected premiums)
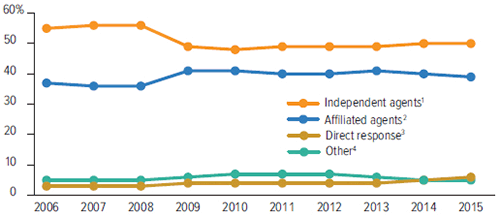
(1) Includes brokers, stockbrokers and personal producing general agents.
(2) Includes career, multiline exclusive and home service agents.
(3) No producers are involved. Excludes direct marketing efforts involving agents.
(4) Includes financial institutions, worksite and other channels.
Source: LIMRA’s U.S. Individual Life 麻豆社 Sales Survey and LIMRA estimates.
(Based on first year collected premiums)
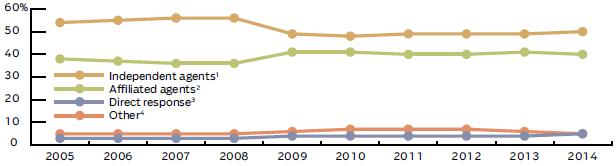
(1) Includes brokers, stockbrokers and personal producing general agents.
(2) Includes career, multiline exclusive and home service agents.
(3) No producers are involved. Excludes direct marketing efforts involving agents.
(4) Includes financial institutions, worksite and other channels.
Source: LIMRA’s U.S. Individual Life 麻豆社 Sales Survey and LIMRA estimates.
(Based on first year collected premiums)
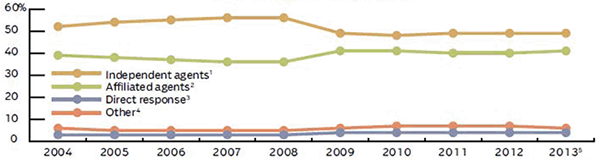
(1) Includes brokers, stockbrokers and personal producing general agents.
(2) Includes career, multiline exclusive and home service agents.
(3) No producers are involved. Excludes direct marketing efforts involving agents.
(4) Includes financial institutions, worksite and other channels.
(5) Estimate.
Source: LIMRA’s U.S. Individual Life 麻豆社 Sales Survey and LIMRA estimates.
(Based on first year collected premium)
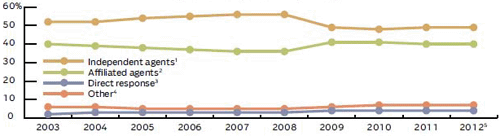
(1) Includes brokers, stockbrokers and personal producing general agents.
(2) Includes career, multiline exclusive and home service agents.
(3) No producers are involved. Does not include direct marketing efforts involving agents.
(4) Includes financial institutions, worksite and other channels.
(5) Estimate.
Source: LIMRA’s U.S. Individual Life 麻豆社 Sales Survey and LIMRA estimates.
(Based on first year collected premium)
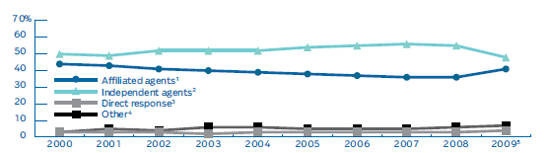
(1) Includes career, multiline exclusive and home service agents.
(2) Includes brokers and personal producing general agents.
(3) No producers are involved. Does not include direct marketing efforts involving agents.
(4) Includes stockbrokers, financial institutions, worksite and other channels.
(5) Estimate.
Source: LIMRA’s Market Share by Distribution Channel Survey, LIMRA estimates.
(Based on first year collected premium)
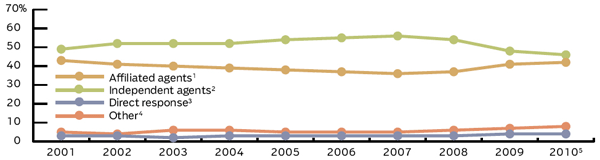
(1) Includes career, multiline exclusive and home service agents.
(2) Includes brokers and personal producing general agents.
(3) No producers are involved. Does not include direct marketing efforts involving agents.
(4) Includes stockbrokers, financial institutions, worksite and other channels.
(5) Estimate.
Source: LIMRA’s U.S. Individual Life 麻豆社 Sales Survey and LIMRA estimates.
(Based on first year collected premium)
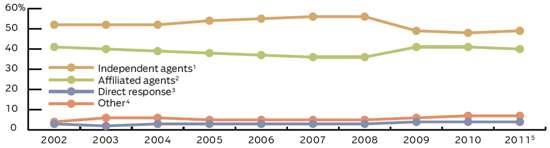
(1) Includes brokers, stockbrokers and personal producing general agents.
(2) Includes career, multiline exclusive and home service agents.
(3) No producers are involved. Does not include direct marketing efforts involving agents.
(4) Includes financial institutions, worksite and other channels.
(5) Estimate.
Source: LIMRA’s U.S. Individual Life 麻豆社 Sales Survey and LIMRA estimates.
(Based on first year collected premium)